
I am a visual person. Sometimes when I am researching someone, whether it is a genealogical search or a historical search, I find it can be extremely helpful to make a timeline or some sort of chart to help me with my search. When you lay out the events and facts of someone’s life, without the clutter of your writing or notation of your sources, you can see the simplicity of someone’s life, and that may lead you to finding more information on that person.
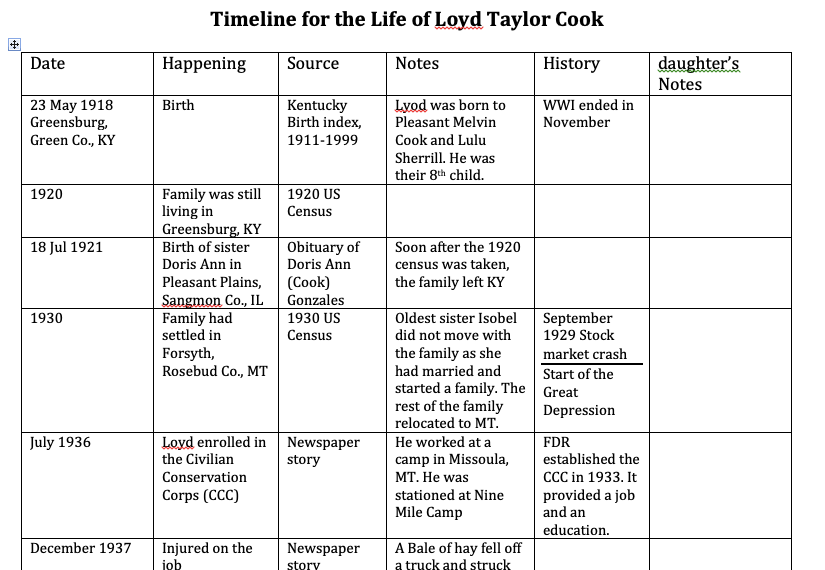
Recently, I went to the movies with a bunch of friends to see The Boys in the Boat, which was about the University of Washington’s rowing team during the depression. So many of these young men came from families that were especially struggling during this era. Some came on scholarships, some worked to pay for their education, but through their participation in the crew, they found themselves on an equal playing field…or river in there case! This story really got me thinking about my friend’s father Loyd. During the depression, his family also struggled, he went on to work in the CCC, and eventually took those skills to Washington, where he put them to use. I thought Loyd might be a good subject to write about. I filled out the tree I had on my friend’s family, paying careful attention to her dad, trying to find as much documentation as I could on his life. As you build a tree on Ancestry, a timeline is created on the profile page, but as I looked at it, I could not clearly see the story I was hoping to tell. So I opened a new Microsoft word document, and began to create my own timeline on Loyd. By considering some to the events that happened in his parents and sibling’s lives and knowing Loyd was living with his family, I was able to add new events to his life. One of the things I see missing was his voice. I sent my timeline to my friend, leaving a column for my friend to enter her dad’s stories.

Another time I found making charts helpful was trying to work out the life of my husband’s great-great-grandmother, Mary Ellen. She was someone who had been a brick wall in my family research for almost twenty years. This was a woman who came to California as a new bride, leaving her history (and family) behind in Ohio. My husband’s Granny knew more about her grandmother’s life in California, but did not know anything about the family she left behind. She had a few stories to tell that I thought might lead to a familial find. The turning point for this search occurred with a distant cousin posted images of the family bible on line. This posting started to pull the pieces of Granny’s stories together with primary sources I had found. I made several charts that compared and contrasted the information I had. Through this process I could clearly see the family connections and was able to draft, I thought, a rather compelling argument as to who was Mary Ellen’s Ohio family. Approximately two years after I felt I found Mary Ellen’s family. One of the historical newspapers I subscribe to, digitized a newspaper with Mary Ellen’s obituary, which named her siblings….and by golly, I was right!

Recently, I was looking for information on how my town handled their indigent population around 1800. As I was going through town records, and recording my findings in a chart, which I intend to use for comparing and contrasting the towns management of their poor, I found information regarding a person I had previously studied. She was a free person of color who married a formerly enslaved man and lived in my town. Church records and town records mention her from time to time, and local history books give her a passing mention. I decided to put all the primary sources into a chart (town and church), and what that chart showed me was that this woman lived here for many years and was frequently harassed by the town fathers. Shameful.
Graphing the fact you find on your ancestors can be extremely helpful with your genealogical researching. Give it a try. I think you will like it!