

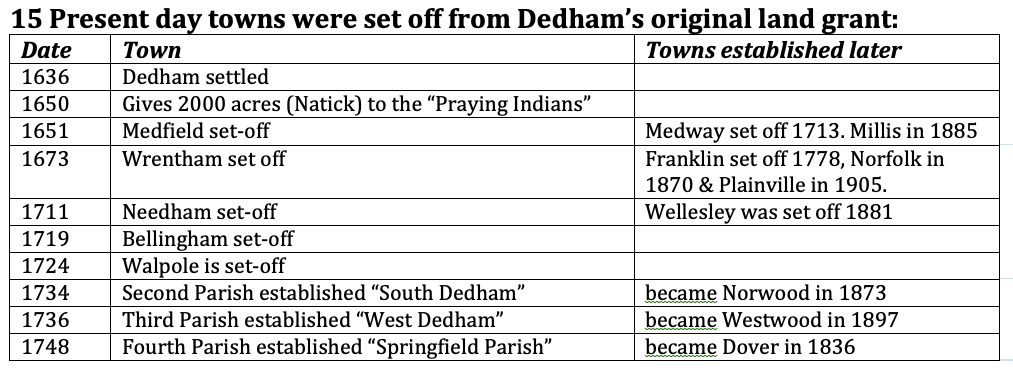
In 1636, to help elevate overcrowding in Watertown, the Great and General Court of Massachusetts established the town of Dedham. Dedham’s original land grant contained thousands of acres of land and stretched as far south as the Rhode Island border and as far west as the border of today’s Framingham. The first families who came to Dedham paddled up the Charles River. Initially they called their new community “Contentment,” but eventually settled on the name “Dedham.” Over the next 250 years, some fifteen towns were created from this original land grant (sixteen if you include Dedham).
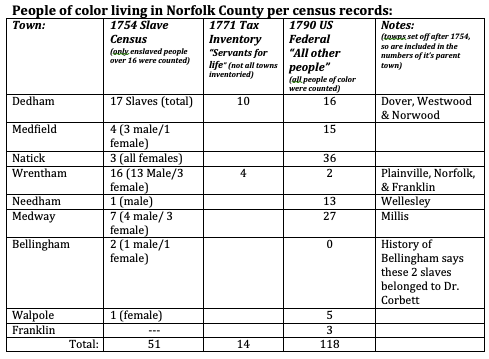
The towns from the Dedham’s original land grant were selected for this study for several reasons. They share a similar history and landscape. They were all part of Dedham and they were largely agricultural communities, however they did contain a couple of small mills (industry) along the shores of their rivers. Enslaved people appear to be a small part of their population. In 1754 the Great and General Court ordered each town to take a census of all their enslaved people over sixteen years of age. It should be noted, there are tax valuation’s for many Massachusetts towns from the mid to late 1700s, that sometimes recorded slave ownership. The next census taken was the first federal census in 1790. It counted all the white people in the home, breaking the count up to white males over 16, white males under 16, and all white females in the home. The next two categories were “all other persons” and “slaves.” Because slavery had been abolished through judicial precedent in Massachusetts, no slaves were counted. As a result, all people of color in the 1790 census fall in the “all other people” column. The 1754 census does not include enslaved teens and children or the number of free people of color in the community, but the 1790 census does, so taking into consideration the children and teens not counted in 1754, and those people of color who were free, it appears there is very little population growth in these communities over twenty-five years.
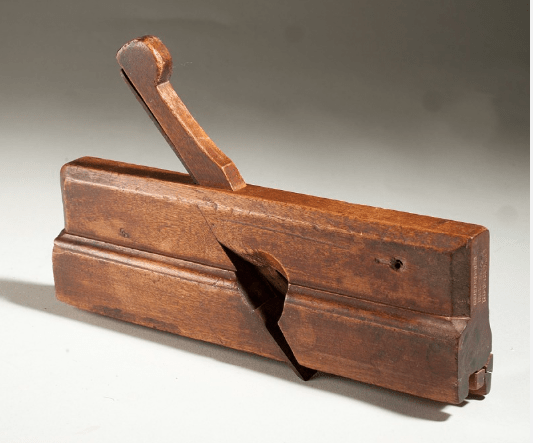
Historians believe the largest demographic of New England enslavers were ministers, merchants, tradesman and doctors. This notion seems to be truer of enslavers who lived in cities, verses those in agricultural areas – another demographic to be considered; wealthy country farmers. It is generally accepted that the enslaved lived in the home with their owners. Taking meals with the family and sleeping in an attic room, they would have labored on the family’s farm or helped out with household chores, and if the enslaver owned a business such as a store, a tavern or a smithy, the enslaved would have worked these businesses too. In the town of Wrentham, Francis Nicholson, a plane maker, owned a black man named Cesar Chelor. When Nicholson died, he not only gave Cesar his freedom but all his tools and workbench. During the years that Cesar was owned by Nicholson, he learned Nicholson’s trade – making planes. With this training and Nicholson’s tools, Cesar was able to support himself and his family and today he believed to be one of the best colonial plane makers. Cesar’s story is unusual because most enslaved people’s stories are lost to history; especially those who lived in small agricultural areas.
It is also important to note large population fluctuations of enslaved people who lived large towns, like Boston, Salem or Dartmouth where their labor was needed in businesses large and small, especially along the waterfront, versus the relatively stable smaller populations of enslaved people in the Massachusetts countryside. In the original Dedham land grant towns, slave population was around 2% of the total population, and in Boston, slave population was around 8% of the total population. Census records confirm a much larger population of slaves lived in Massachusetts’ port cities, like Boston, Salem, Dartmouth and Scituate, and often more men then women. Boston was clearly the largest city and also had the largest population of enslaved people; 989 counted in the 1754 census, and 761 “all other people” in the 1790 census. This dramatic population drop is thought to be a reflection of white laborers moving into the city edging out jobs for black laborers. Certainly, some may have relocated to other towns where they could find work, but another notion to consider is the likeliness that many of Boston’s enslaved people where shipped out after 1783 to places where slavery was legal.

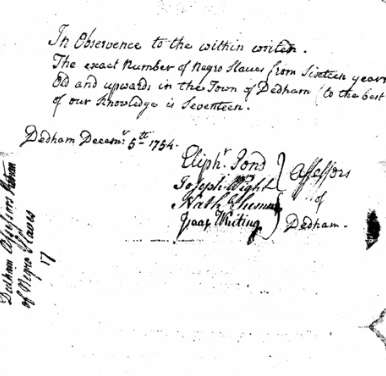
Images of the 1754 Massachusetts Slave Census for Boston and Dedham
It seems possible census numbers in 1790, reflect that some people of color relocated to Salem and southern Bristol County. In Salem the enslaved population in 1754 was 83 people over the age of sixteen, and twenty-five years later in 1790, they had 260 “all other people” in their town. These numbers show a marked increase of people of color living in Salem. Population numbers in Dartmouth also show an increase in people of color in town over the same twenty-five year period. By 1790, two new towns, New Bedford and Westport, had been established from Dartmouth. This area of Bristol County, Massachusetts is known for it’s whaling industry. In the 1754 Massachusetts Slave census, Dartmouth recorded 34 enslaved people over sixteen, and in 1790 there were 176 “all other people” living in Dartmouth, Westport and New Bedford. Scituate was another waterfront town that participated in the ship building industry. It’s census numbers regarding people of color show in the 1754 Massachusetts Slave census 43 enslaved people over sixteen in Scituate, and by 1790, Scituate has total of 65 “all other people” in town. These numbers indicate a relatively stable population of people of color. The stability reflected in Scituate’s people of color, is similar to the population stability of people of color in Dedham, a large agricultural town.
Enslaved people were needed in both agricultural towns and waterfront towns. The jobs these people performed and why their labor was needed may or may not be for similar reasons. Census numbers from 1754 show more males in these communities than females. Men were needed to provide manual labor on the waterfront, for shipbuilding, loading and unloading boats and as seaman. While in the countryside, males were needed mostly for farm labor. However, also in these large towns, many enslaved people were skilled laborers and crafts people; bakers, coopers, weavers, printers, and blacksmiths. These skills would have been in higher demand in large towns verses in agricultural communities. While most jobs enslaved people performed in the countryside was physical labor, some blacksmiths and carpenters can be identified. It appears having a skilled job meant a free person of color was able to find steadier employment than those without specialized training.
Studying the hidden histories of slavery in some of the original Dedham land grant towns, should illustrate the similarities and possibly the differences of the lives of people who had been enslaved there. Performing simple internet searches for “slavery in <town>” does not yield a lot of hits. In order to tell the stories of enslaved people who lived and worked in the original Dedham land grant towns, it became clear the starting point was in identifying the enslavers from these towns, and then looking at their wills and estates to identify who they enslaved, and the reasons the kinds of jobs they needed their enslaved people to perform.
